
Cross-carrier coupling
Conversion, storage and transport modelled across carriers in one solve.
Nohm Atlas
Atlas is the geographic operating surface for Nohm: network reality, land context and model outcomes in one place.
Network intelligence
Electricity, methane, water, energy liquids and logistics remain distinct, while their dependencies become visible.
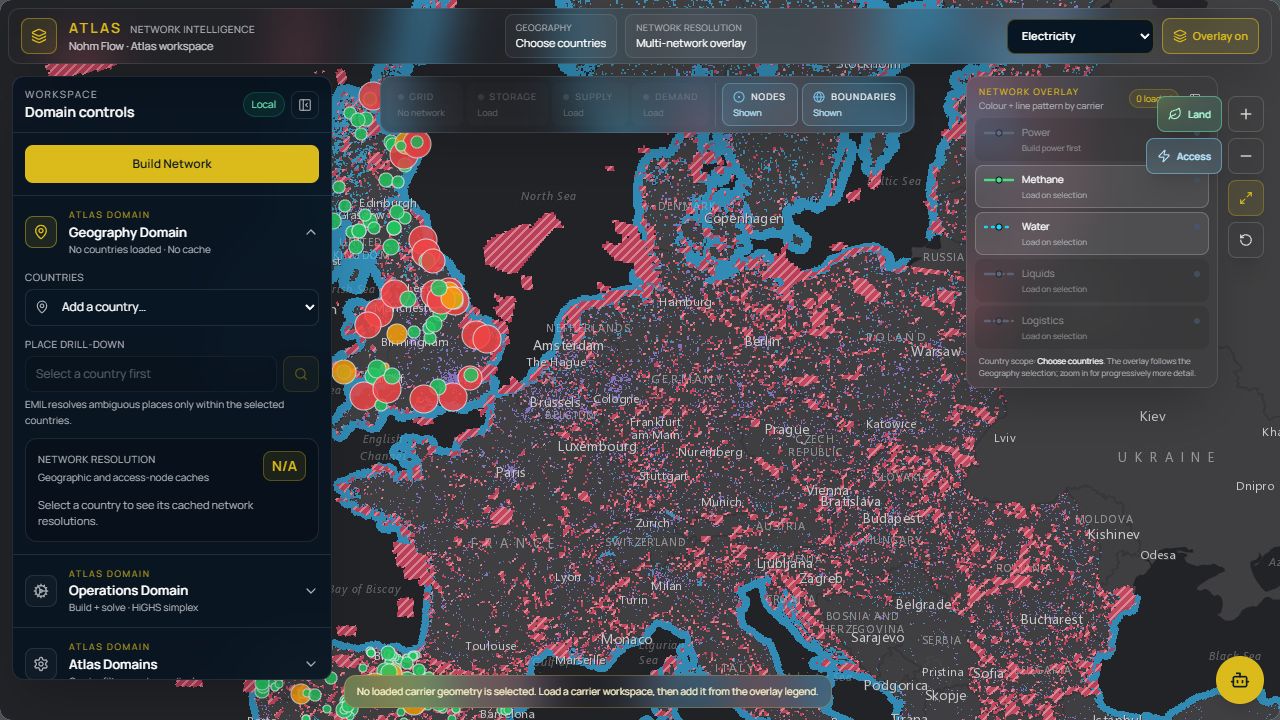
Strategic screening visualisation. Basemap/data: Esri, EEA/Copernicus, OpenStreetMap contributors and project notices. PyPSA visuals © PyPSA-Eur Authors, CC BY 4.0.
Connected infrastructure
Grid, generation, storage and demand
Transmission, supply and conversion
Resources, treatment and industrial demand
Production, terminals and movement
Ports, rail, road and material flows
The substrate / From geography to a model
Atlas brings five infrastructure systems into view. The modelling substrate connects four energy carriers, the resolution of a study and the climate assumptions behind it.
01 / Connected carriers
Electricity, hydrogen, methane and synthetic fuels, with the interactions between them represented rather than approximated. An electrolyser is a load, a flexibility asset and a hydrogen source at once — the model needs to account for all three.
Conversion, storage and transport modelled across carriers in one solve.
Residential, buildings, transport and industry down to end-use.
Energy carriers
Choose the level of detail per study, with the connections between carriers kept in view.
02 / Resolution
Explore Europe at one node per country, then take the same scenario down to unit level where the answer actually turns. Granularity is a property of the run, not a fork of the model — the coarse and fine answers stay comparable.
Draw a geography, set a granularity and build the model section around the question.
Combine, mutate, graft and reproduce scenarios rather than copying folders.
Granularity
Start wide. Add detail where the decision depends on it.
03 / Climate assumptions
Multiple climate years from PECD — onshore wind, offshore wind, hydro inflow and temperature profiles — with historical coverage plus SSP2-4.5 forward trajectories.
Test the dry year and the still year alongside the average. Keep climate assumptions attached to the scenario so differences in the results can be explained.
Onshore & offshore profiles
Inflow by catchment
Heating & cooling demand
Forward trajectories
Atlas is a decision environment, not merely a map.
See how Nohm answers